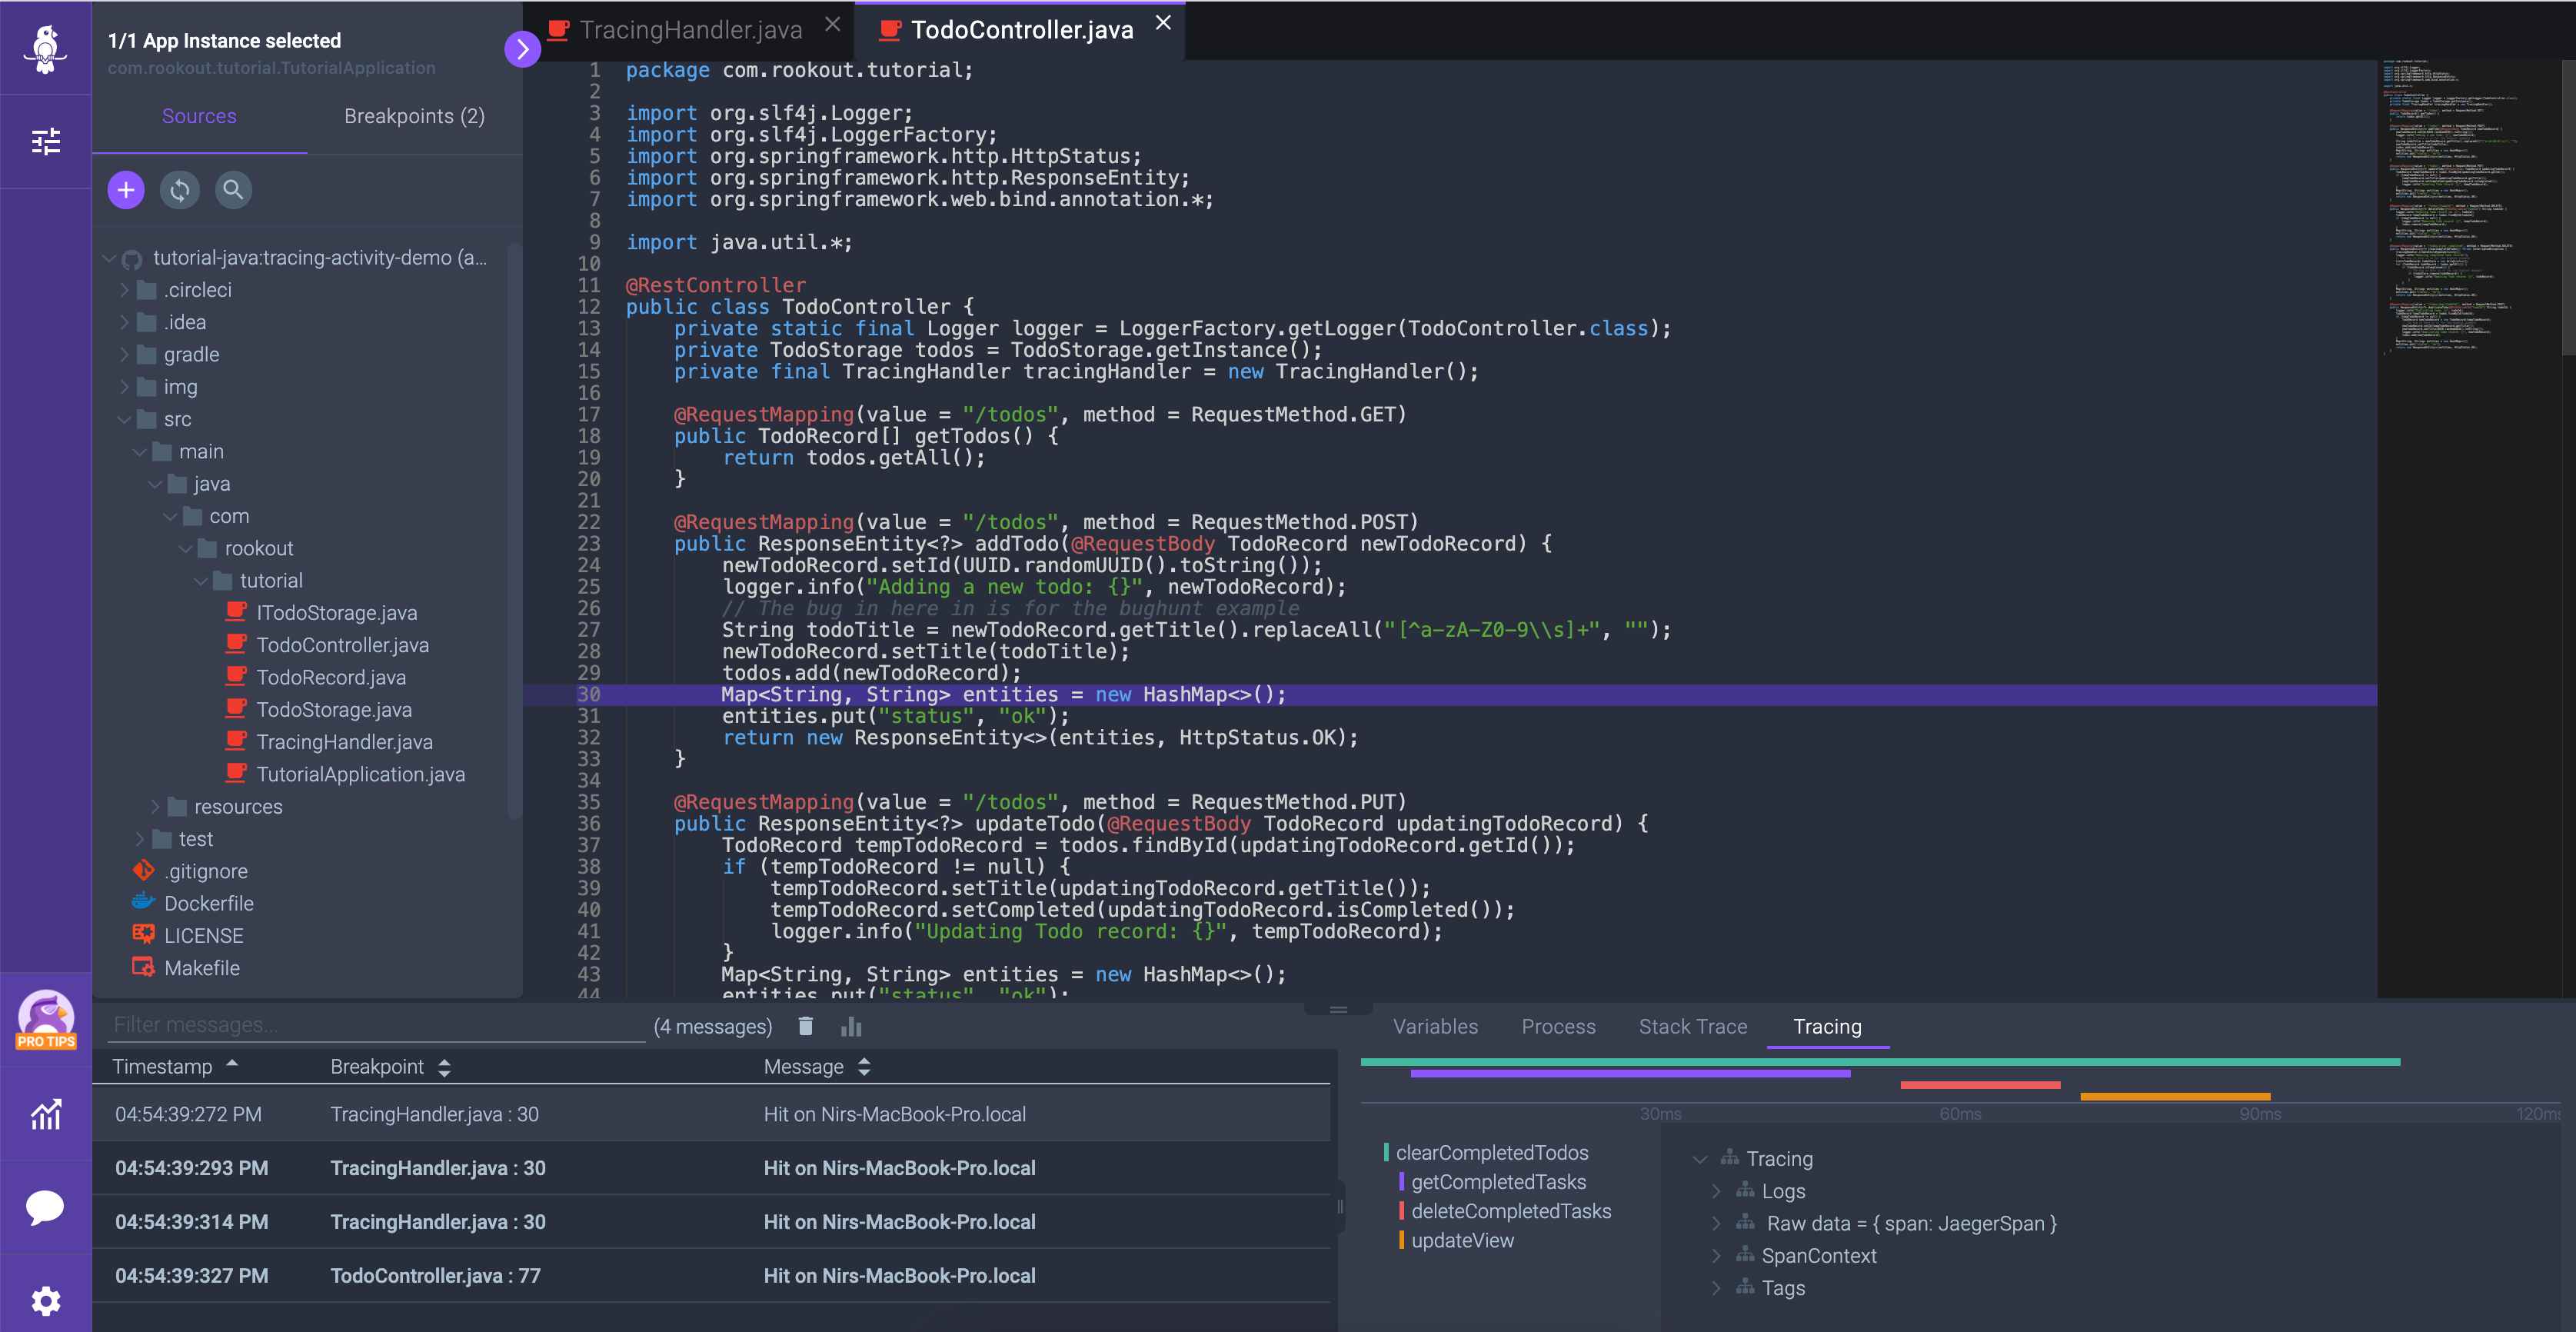
Tracing Timeline
Rookout’s Tracing Timeline enriches your debug session with transaction information over a time dimension graph. By viewing debug snapshots side by side with the application’s tracing information, you get a holistic view that empowers your debugging and troubleshooting experience and allows you to get knowledgeable decisions.
To use Rookout’s Tracing Timeline add a breakpoint next to the line of code that you wish to trace, then trigger the breakpoint and make sure snapshots were received. Click on a snapshot and navigate to the Tracing tab. Inside the tab, the Tracing Timeline graph will be displayed, presenting spans and context of all the transactions made within this code section.
Rookout Tracing information is available for Java and Python applications that implement OpenTracing. For more information, contact us at support@rookout.com.