Rookout Setup Guide
This guide should help you set up Rookout within your environment, from setting up the Rookout SDK through using Rookout's user interface and debugging your application.
The Rookout architecture
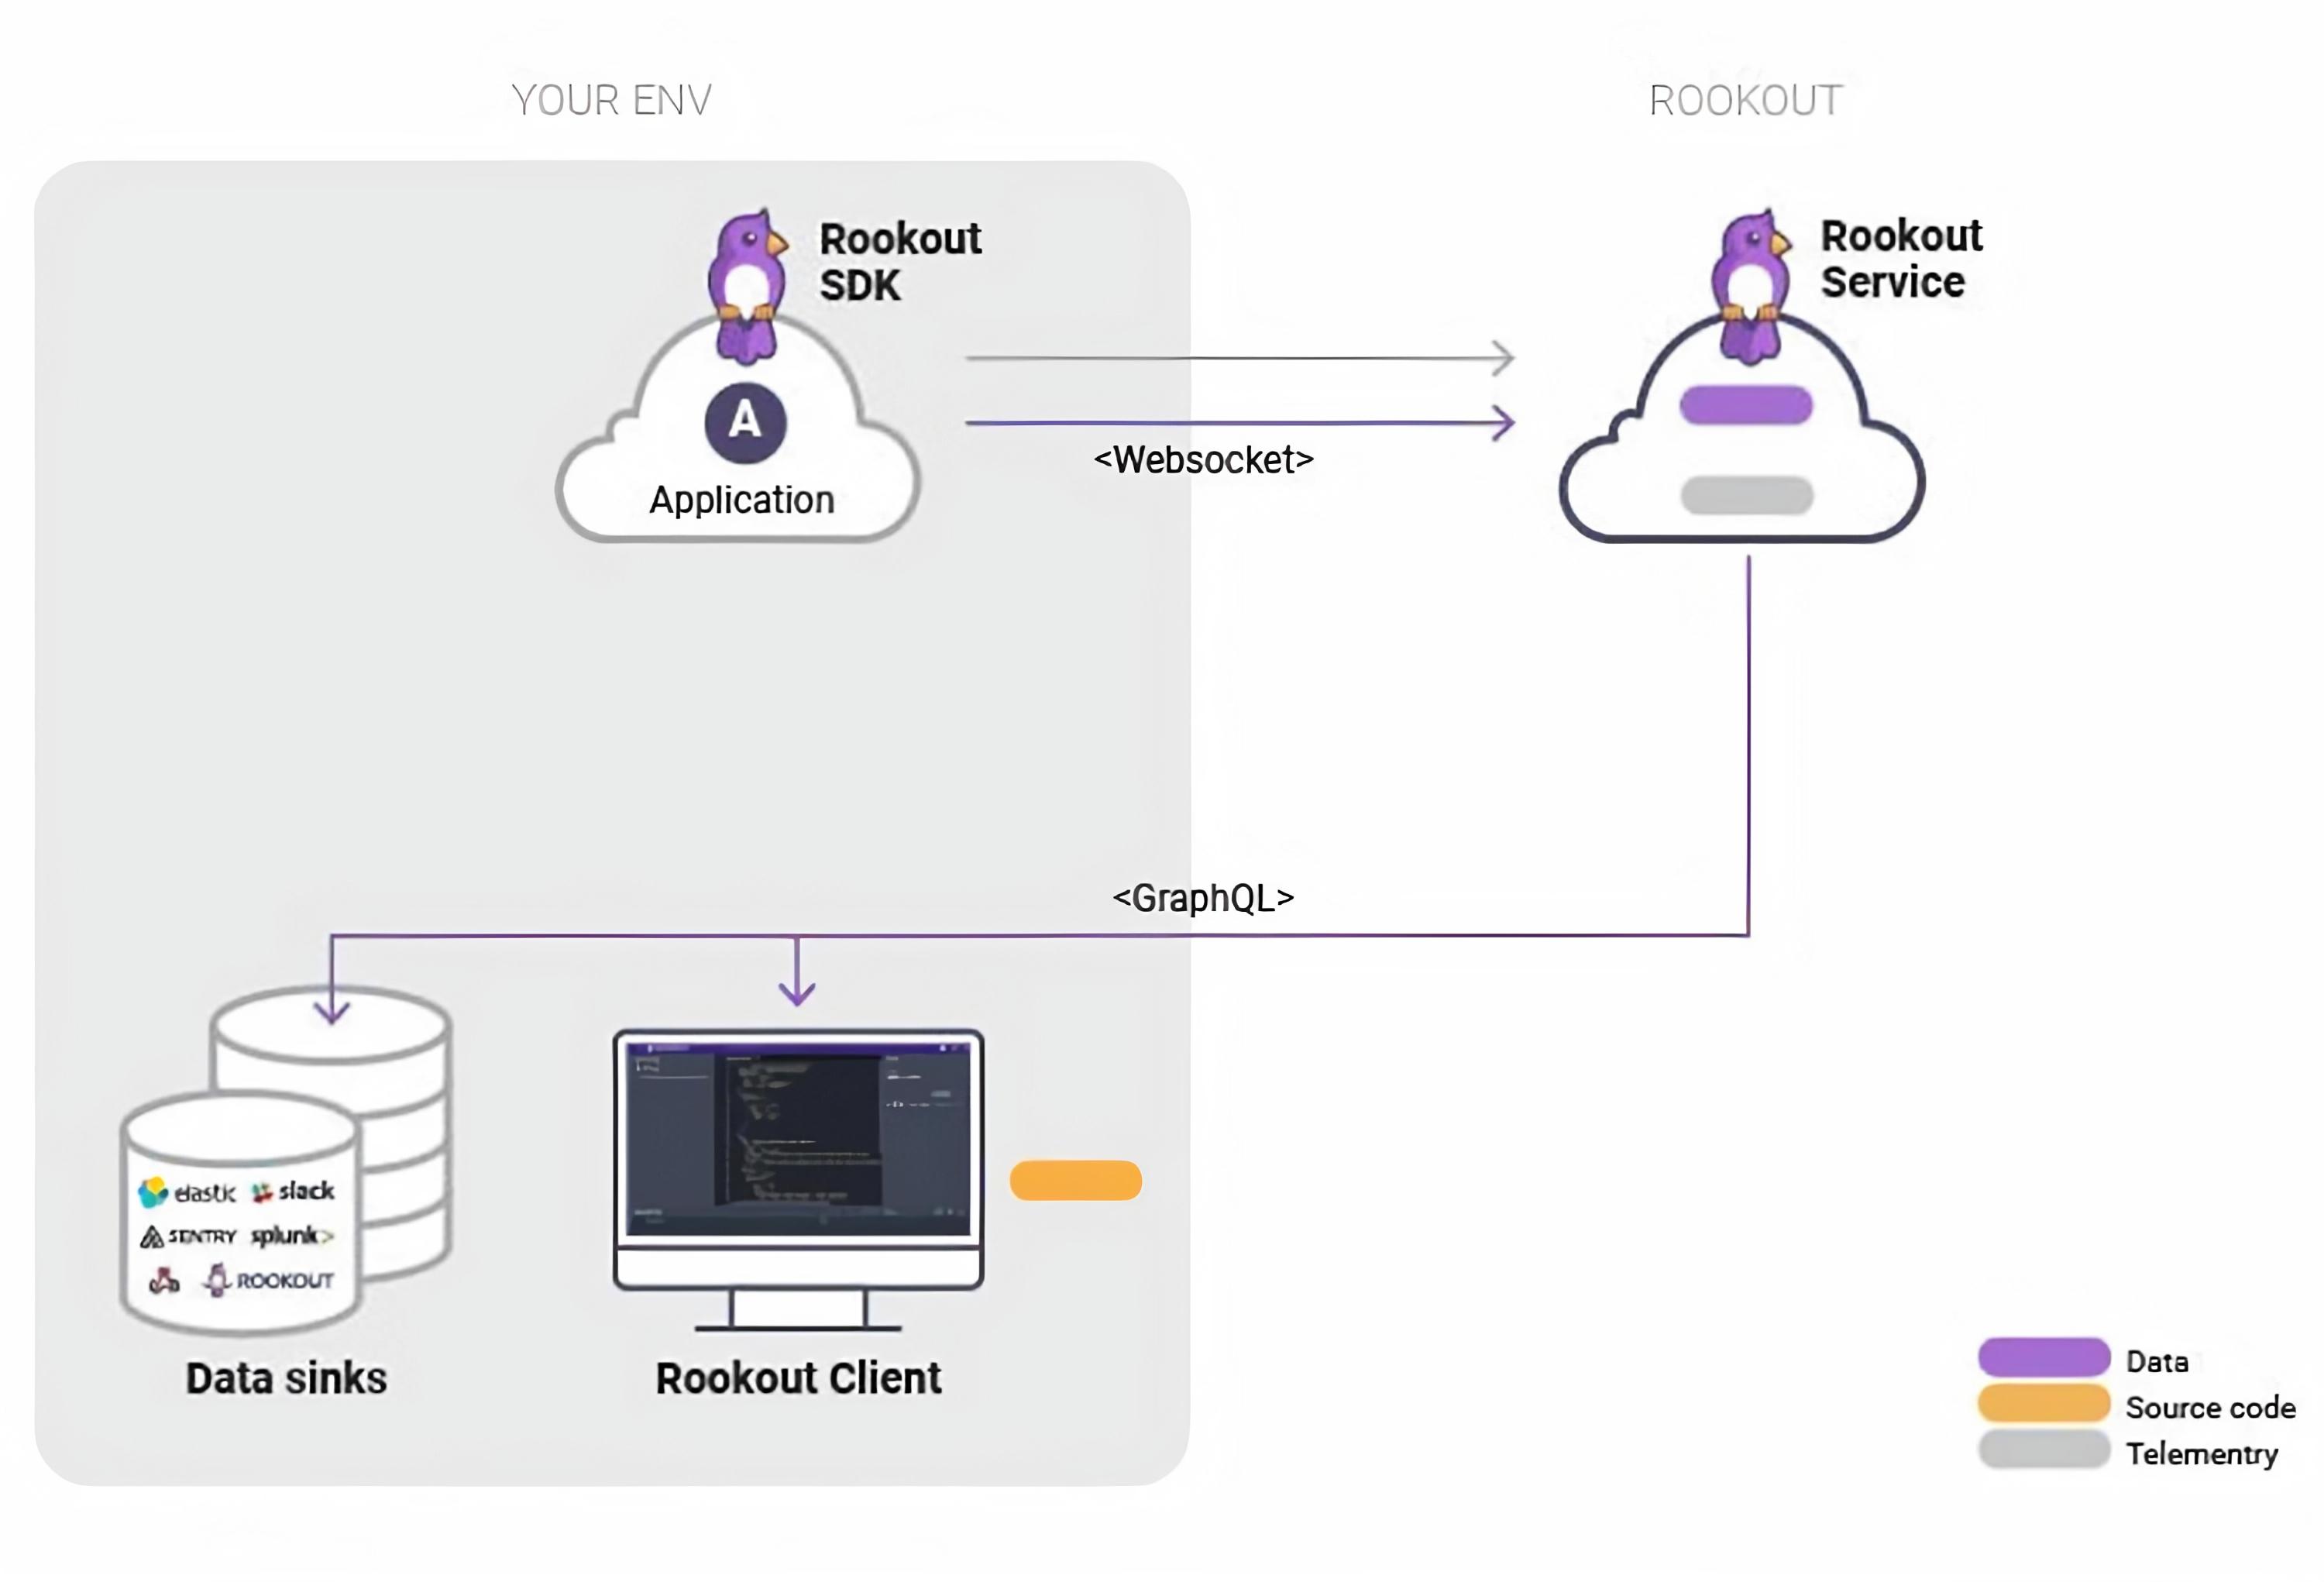
Before using Rookout to debug your application, it’s helpful to understand the architecture and examine how Rookout works. Rookout consists of the following components:
- Rookout SDK
- Rookout Client (Web UI)
- Rookout Service
- Rookout Data On-Prem Components (Optional)
The below diagram shows the pure SaaS deployment model. The Rookout SDK connects back to the Rookout Service via a secure WebSocket connection. Data collected by Rookout can optionally be sent to 3rd party data sinks for long-term persistence.
Rookout SDK
The Rookout SDK is a set of libraries that are configured as a dependency in your application. It communicates with the Rookout Service and allows Rookout to collect live debug data on demand.
Rookout Client
The Rookout Client is a web-based UI where you have the ability to dynamically debug your application through the setting of non-breaking breakpoints (also known as data collection points). All user interactions with Rookout are done from this UI.
Rookout Service
The Rookout web interface is a Software-as-a-Service that acts as a control plane for your debug sessions and as a data plane for processing debug data.
https:
Rookout Data On-Prem (Optional)
To learn more about Rookout's data on-prem offering, visit this page or contact us.
Deploying the Rookout SDK
To install the Rookout SDK, first, add the SDK as a dependency. Then, only a little one-time change to each application or service is required.
Once the Rookout SDK is added, it runs in the background with your application and allows you to collect the data you need when you need it.
Rookout deployment steps vary slightly between programming languages, visit the links below for setup instructions:
For more framework-specific examples, check out our deployment examples.
Configuration
Every SDK deployment requires some configuration. Set configuration parameters using environment variables or pass them as arguments to the SDK's start function (supported in some languages).
ROOKOUT_TOKEN: The Rookout token is unique to your Rookout organization. Any SDK instance deployed with a Rookout token can connect to its corresponding Rookout organization. You can find your token by clicking on the settings icon in the Rookout app.
ROOKOUT_LABELS: Labels are a way for you to tag the services/applications where Rookout is deployed. The labels are customizable `` pairs that you can use for environment, applications, or any other labeling you like. For more details on labels, see this page.
The following parameters are used so that Rookout automatically fetches your source code when debugging:
ROOKOUT_REMOTE_ORIGIN: Set this to the URL of the git repository for the service/application.
ROOKOUT_COMMIT: Set this to the ID of the commit that Rookout should fetch (we recommend automating this using a CI tool or another method).
Rookout can also fetch your source code by including the .git folder in your deployed application. For more details on this approach, see this blog post.
Debugging With Rookout
Once you have Rookout deployed in your application, you are ready to start debugging. Let’s take a look:
Filtering Application Instances
Once you have logged in to Rookout, the first step is setting up your debug session by selecting the applications or services you would like to debug.
In the debug session configuration screen, you can see all Rookout SDK instances running in your environment.
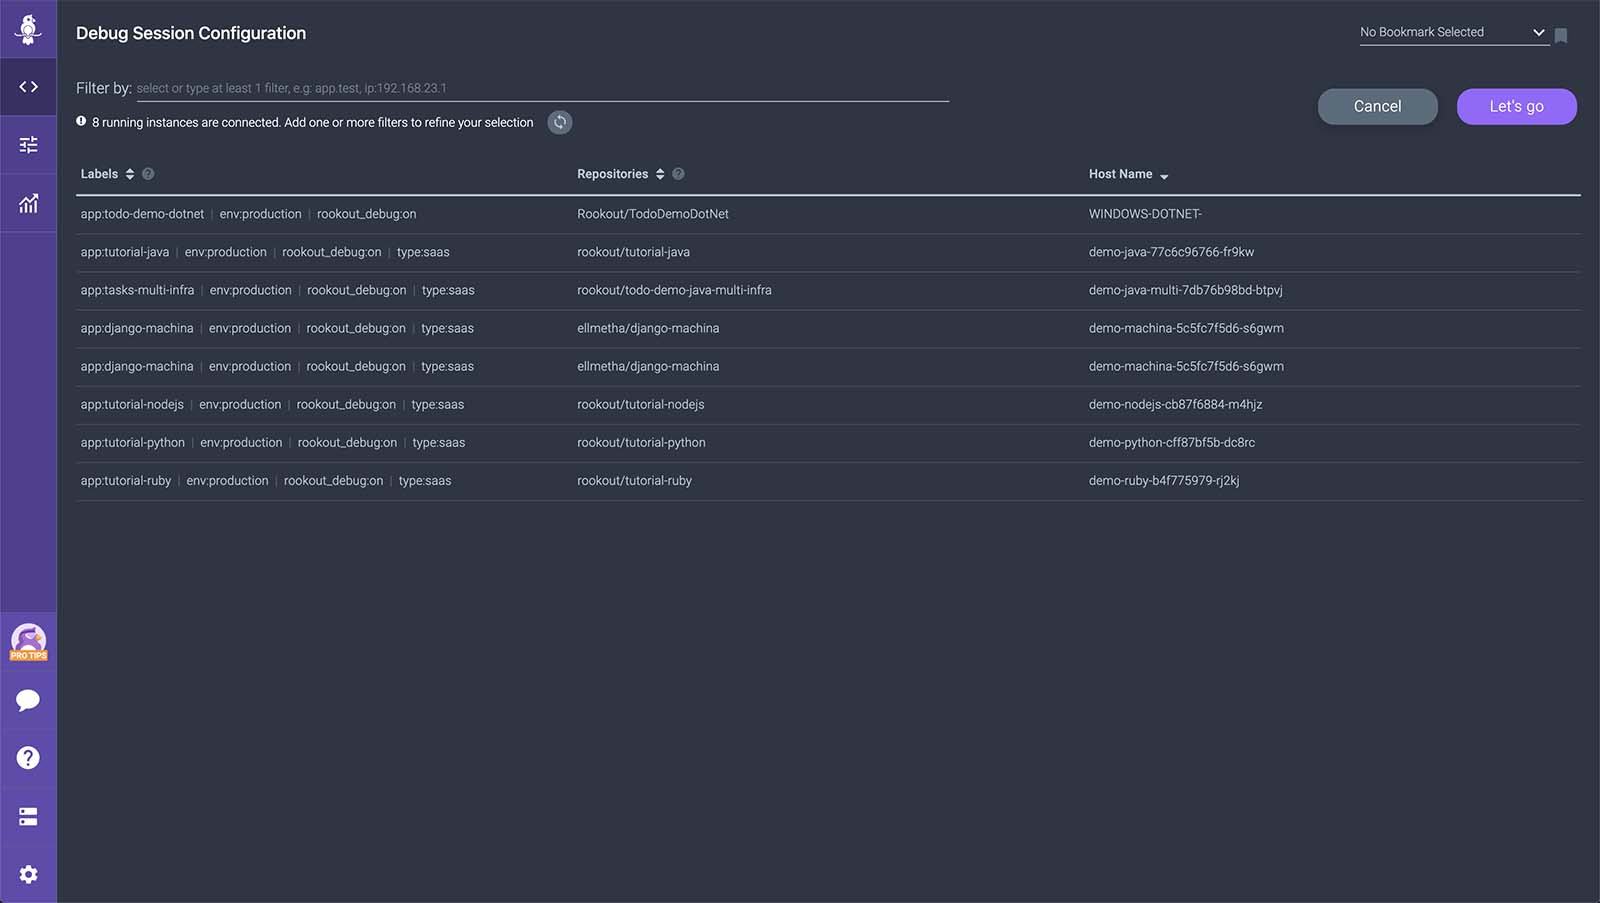
To choose instances to debug, enter a filter in the "Selected Instances" textbox. You can filter using the following methods:
- Labels
- Process name
- Source code
- Hostname
For more details refer to this page: Debug Session Setup
Connecting Source Code Repositories
Note that your source code is never sent to or seen by Rookout's servers. It is only stored in your browser, on the client-side.
The steps to connect your source code repository differ slightly based on whether you are using an on-prem server of your source control provider or the cloud/hosted version.
Cloud/Hosted Repositories
If you configured the sources-related environment variables (or included the .git folder) as described above, Rookout should automatically fetch your source code. If not, you can manually connect to your source code repository. In the debugging view, click the + button and select your source code repository from the list.
Next, follow the steps to authenticate with your source control provider and select the repository and commit you would like to use.
On-Premise Repositories
To connect to an on-premise or a self-hosted source control server, other than configuring the source control options as described above, you also need to configure the server in the Source Control page of Rookout (under Settings -> Source Control).
In the Source Control page, select the server type and enter the URL. Do not include the specific repository. Next, go back to the session configuration screen, select the instances to debug, and click Let’s Go. This time you should be prompted for a Personal Access Token. Rookout requires a personal access token for your source control server to fetch your repository.
For Bitbucket servers, you should also install the Rookout Desktop App and ensure it’s running. You can download the latest release here:
Local Filesystem
The Local Filesystem option lets you fetch the soruce code from your local computer. This option uses our lightweight desktop application ("Rookout Desktop App") that runs on your local system and lets you choose a locally cloned repository.
For more information on source fetching, refer to the following link: Source Repos
Setting Non-Breaking Breakpoints
Once your source code is available in the Rookout web IDE, you are ready to start debugging. Let's go ahead and set some non-breaking breakpoints. To set a non-breaking breakpoint, open a file from the view on the left, locate the line of code you would like to debug, and click on the area to the left of the line number to set a breakpoint. Once the breakpoint is set, go ahead and interact with your application and trigger that line of code.
When a non-breaking breakpoint is triggered, you should see messages in the message pane at the bottom left part of the screen. Click on an individual message to view the data Rookout had collected.
For more information on Non-Breaking Breakpoints, refer to this page: Debug Session Setup
If you encounter an issue while setting a breakpoint, refer to this page for information on breakpoint statuses: Breakpoint Status