Instances Selection
Before starting a Live Debugger session or a Live Logger session, you will need to select which application instances you would like to debug.
Set up your Debugging or Logging Session
To start your debugging or logging session, you will need to select one or more filters from the table or drop down list as shown in the video below:
Filters can be chosen either directly from the table by clicking on the appropriate row/column in the table or from the drop down menu by choosing from the following categories:
Labels:
Labels are name:value pairs which you can tag instances with when you deploy Rookout. It is a best practice to label environments using the 'env' name, for example 'env:prod'. To read more about labels, see the labels page.
Repository:
Choose instances according to their source code repositories. You will need to ensure you have confirugred automatic source code fetching as desribed on the source code fetching page.
Hosts:
This filter allows you to select an instances by IP address or hostname.
Revisions:
This filter allows you to select an instance based on a source code commit revision hash.
Process:
This filter allows you to select an instance based on a process name.
General Filters:
This section contains the 'serverless' filter. Since serverless instances don't execute until the serverless function is invoked, this filter allows you to start your debug session before your instance is running.
In addition, for Kubernetes deployments, Rookout will automatically create labels based on the name of the deployment as well as the namespace.
Click Start Debugging to start your debug session.
Click on the purple arrow from your current debug session to edit and change selected instances.
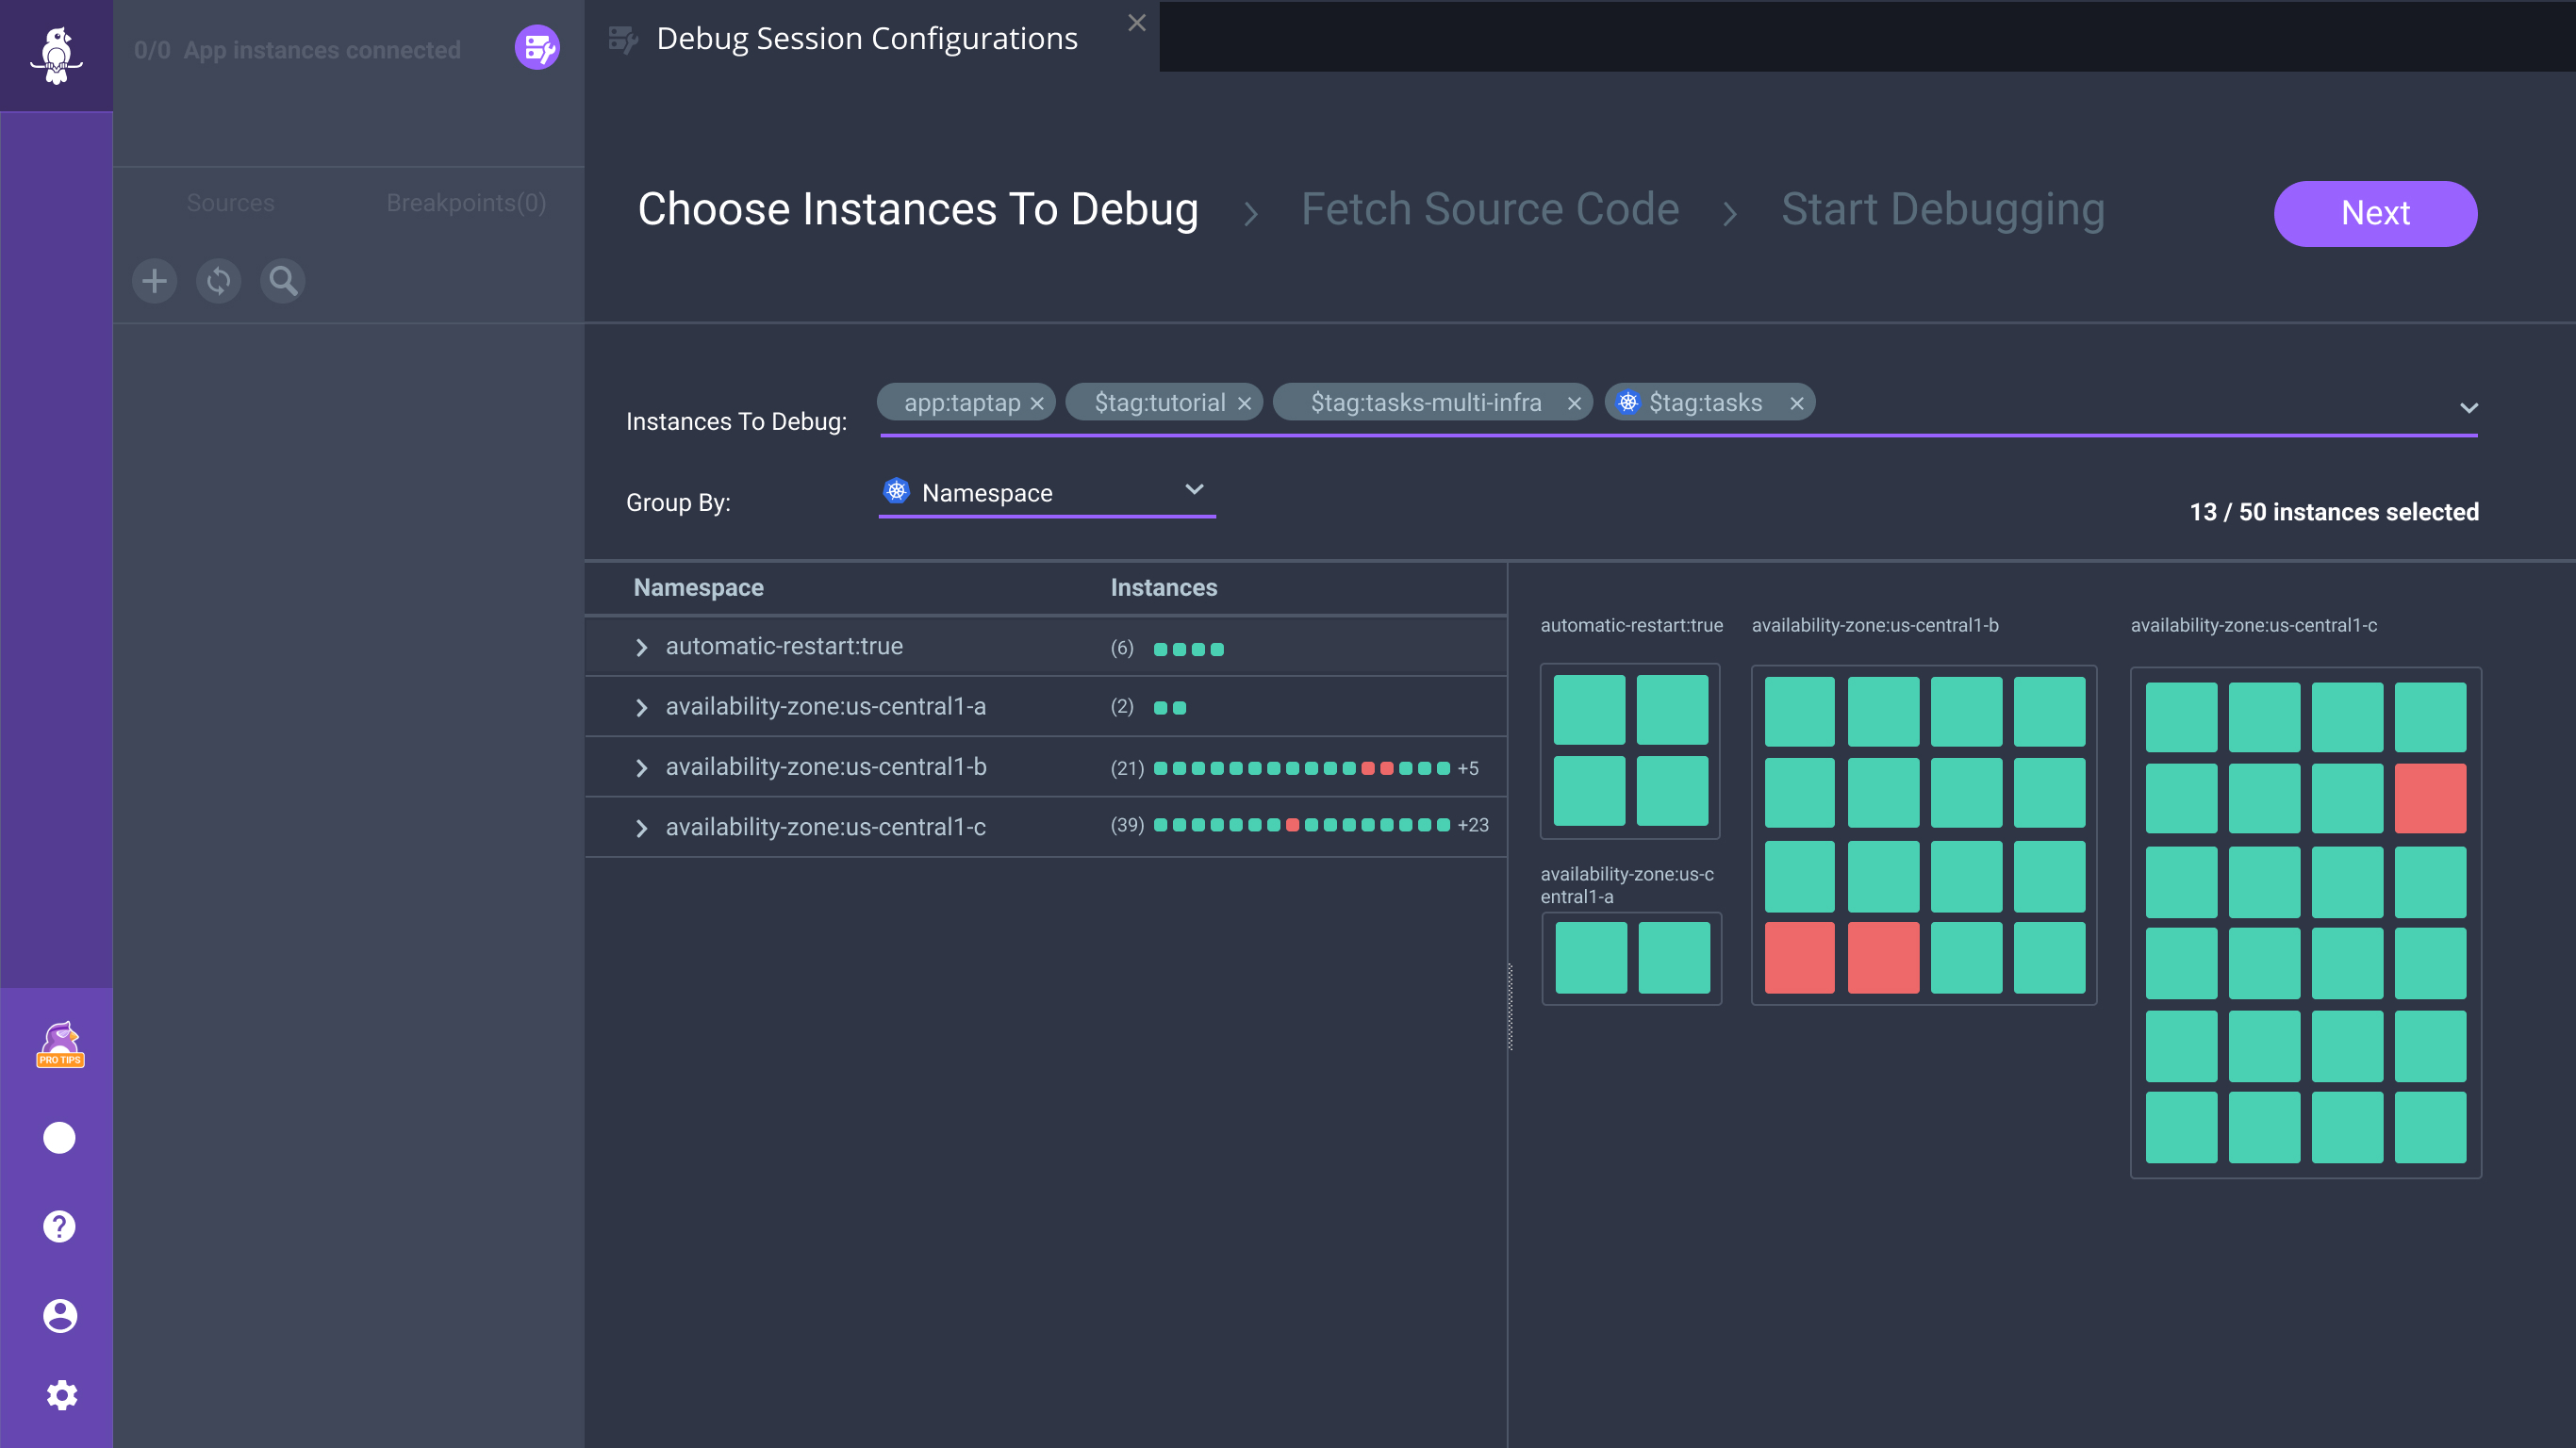
Cloud-Native Debug Session
Visualize your Kubernetes environment. Rookout’s Cloud Native Debug Session allows you to group and filter by Namespace, Cluster, and other Kubernetes-specific attributes, giving you a clear visual display of your application’s pods and clusters grouped by K8s-driven categories.
To enable Cloud Native Debug Session for your account, contact Rookout support.